Spending Data Handbook
Data-driven research
Whether you are a member of a civil society organization, a journalist, or a citizen watchdog, the fundamental technique for working with spending data is the same. We call this technique data-driven research. In this approach, data is used to build compelling arguments by iteratively proposing and testing hypotheses.
This chapter sketches the phases of the data-driven research process: stating an assumption, testing it by performing analysis, and finally presenting results. It also explains how different steps in the process connect with the other chapters of the handbook.
As a concrete example of this general approach, this chapter also presents a close look at data-driven advocacy as practiced by civil society organizations (CSOs).
The data-driven workflow
Working with data almost never means traveling in a straight line. In data-driven research, the facts are allowed to reshape your underlying assumptions, usually many times over. When a data-driven project goes in circles, that means everything is going according to plan!
Data-driven research can be broken into two major phases: iteration and presentation. The iteration phase can itself be broken down into two sub-phases: forming and testing hypotheses.
Iteration
Forming hypotheses
It's impossible to approach a set of data with no assumptions or preconceptions. In order to get the most out of working with data, the first task is always to identify those assumptions, make them explicit, and then interrogate them ferociously.
Once a set of assumptions has been made explicit in this way, it becomes a hypothesis that can be tested.
Forming interesting hypotheses requires domain-specific knowledge and experience. The Spending Data Handbook leaves it to you to apply your expertise and ask good questions!
Testing hypotheses
Once a hypothesis has been stated, it can be tested. Data is collected from reliable sources (or generated by the researchers) and subjected to analysis. The analysis may either support the hypothesis or falsify it.
Explaining what data is and how to gather, process, and analyse it will be the focus of two sections of the Handbook, "Data literacy" and "Working with data".
Iterating
If the hypothesis has been falsified, the process usually starts over. A new hypothesis is formed, new data is collected (optionally), and another round of analysis either supports or falsifies the new hypothesis.
An interesting hypothesis supported by analysis is a result which you can then communicate. Sometimes the "negative result" of falsifying a widely shared assumption is an interesting result in itself.
Presentation
An interesting research result doesn't speak for itself. You need to communicate it. This takes place in the all-important presentation phase of research.
In this phase, researchers narrow down the message they want to convey; they identify the audience they want to reach; and they think about the outcome they want to achieve by communicating their message to that audience.
Presenting and communicating data analysis is the focus of the fourth section of the handbook, "Presentation and engagement".
Successfully communicating results can call for a wide range of technical skills. For this reason, it is important that researchers work together to share their strengths, and it is also important that they understand how to effectively collaborate with technology experts. Collaboration on data-driven research is the topic of the fifth section of the handbook, "Working with others".
Data-driven advocacy
Is going out and provoking a riot the best way to get a Government to take onboard your message? There are alternatives: you can hit them with the data hammer instead!
Civil society organizations can apply data-driven research to build compelling policy proposals. We call this approach data-driven advocacy. Below, we explain how it relates to the general technique of data-driven research.
Hypothesis formation: what is the public interest?
Data-driven research begins by identifying and interrogating the assumptions we bring to data. For CSOs, these assumptions usually have to do with "the public interest". What is that?
Acting in the public interest requires CSOs to analyse conflicting assumptions and work out which one is more valid. This often means carefully examining both sides of a controversy. For example, in Greece, Spain, and many other European countries, people protest almost every day as their governments cut spending to bring down their budget deficits. If the goverment wanted to keep its current level of spending but increased taxes to increase its revenue, different citizen groups would still protest, depending on which taxes would be increased. In any case, there will always be more than one interpretation of any government policy, and interested sides to support it (or not).
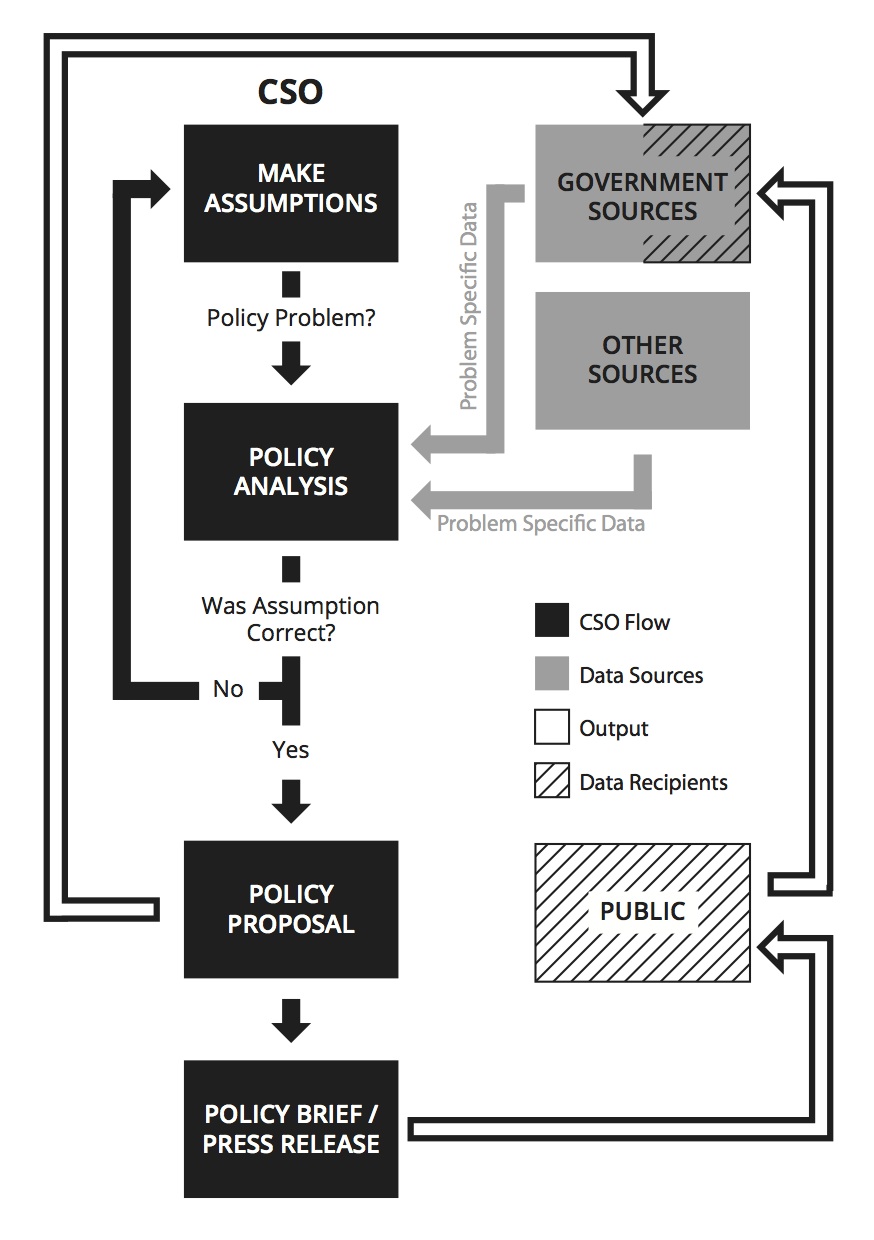
Hypothesis testing: analysis of government data
Once a CSO has defined a clear policy problem and identified its goals and the results that different stakeholders are trying to achieve, it can systematically search for the data needed to create its own policy proposals. Data relevant to policy research can be obtained from the government, from other sources including academic journals and private companies, or generated by the CSO itself.
Once the data has been gathered, a subject-specific specific methodology is used to analyse it, and based on this analysis, hypotheses can be rejected or approved. If the hypothesis is rejected, the process repeats. If the hypothesis is supported, the results are used to make a policy proposal to the government.
Presentation: policy proposals
For CSOs, it is important to recognise who is a decision maker and, hence, who should be targeted by a policy proposal. Policy proposals should be methodologically well structured, evidence-based, open for debate, and scientificaly evaluated. Governments will seldom take policy proposals as their own policies, but proposals may actually change their courses of action, as well as lead to new insights, views, and understanding of the subject. Policy briefs can also be used to approach government officials or turned into press releases to get the attention of the public.
Example: fish subsidies
The influence CSOs have on government policy comes from a wide and varied set of activities. These can range from producing a widely shared dataset or infographic which subtly influences the mood of policy makers to more targeted CSO advocacy and lobbying on issues where they are experts.
The Fish Subsidies group is a nice example of a CSO engaged in targeted activites. Having collected a comprehensive set of data on fishing subsidies paid under the European Union’s common fisheries policy, they broke this down into payments for every EU member state and then complemented this with other activites related to fishing.
They have produced a report assessing the environmental and social impacts of the Financial Instrument for Fisheries Guidance between 2000 and 2006. This extensive document fed directly into the EU political decision making process.