Spending Data Handbook
Analysis
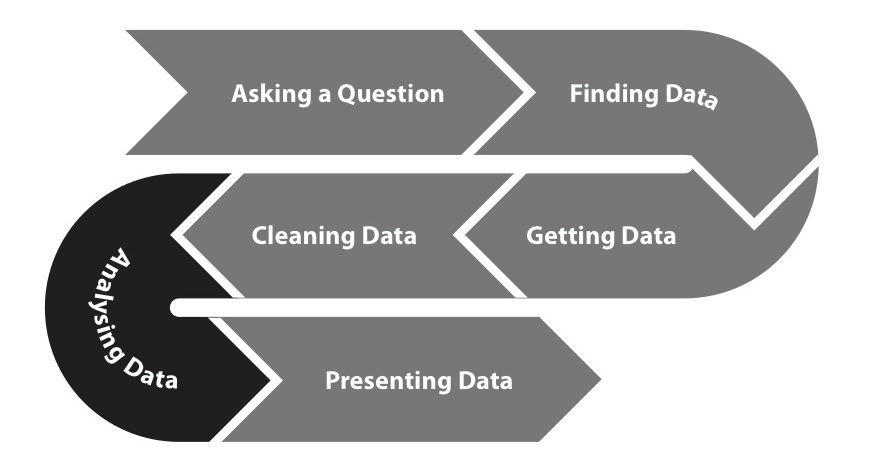
The data Processing Pipeline
We know you're the expert, and we're not going to presume to teach you how to analyse your data. This chapter's aim is to provide a basic checklist of standard post-processing and analytical steps that can help prepare your data for more in-depth analysis.
Sorting data
The simplest way to find something interesting in data is to sort by a column or category. In spending datasets, it's common to rank data by the largest transactions and look at the beneficiaries. This also gets you the maximum or minimum values of a column, which can themselves be interesting.
Basic statistical analysis
Statistics such as percentiles and averages are essential characterizations of your data. Most spreadsheet programs and programming languages offer tools to compute these statistics. A more complete list of statistical tools and resources can be found in the "Resources" chapter of the appendix.
- An average is a measure of the central tendency of a sample. It can be described as the "typical" or representative value of a set of data points. Knowing the average helps detect whether any single payment in a dataset is atypical.
- A percentile is the value of a variable under which a certain percentage of the data fall. For example, if a transaction amount is in the 90th percentile, then it is larger than 89% of the transactions in the dataset.
- A standard deviation measures how far away a value is from the average. If your standard deviation is low, then it means your row values are clustered together. If it's high, then they are spread out. By checking for values that are one, two, or three standard deviations outside the mean, you can detect outliers. Outliers could be errors or extremely interesting data points.
Summarizing or aggregating by categories
Sometimes data is available at a very high level of detail, making it hard to see the big picture. It's a good idea to have a standard set of categories to aggregate by, such as geographic unit, functional classification, account number, fiscal year or other temporal unit, government department, or even recipient.
Normalization for comparability
In order to be able to compare data across time or other parameters, you may need to systematically adjust the data values. Here are some examples.
- Deflation or inflation. Expenditure data is naturally obtained with current (or nominal) money value, but such data is not directly comparable across different years because inflation affects the value of money. In order to compare currency across years, it is necessary to deflate or inflate the value according to a base year. For example, if we wish to compare the budget of a program in dollars from 2000 with the same program in 2012, we must adjust the value of the 2000 data and the 2012 dollars to a base year. Deflator and inflator factors are calculated by central banks in most countries, and a comprehensive list by country can be found at the World Bank website.
- Scale and normalize values. When we wish to compare patterns of budget programs, sometimes the difference in scale between budgets may prove difficult to display in a graphical form. In such cases, it's useful to compare percentages instead of absolute numbers. It's very common to express budget and spending data as percentages of a country's GDP instead of in absolute numbers, for example. If you're mapping spending, make sure to scale your data by population density—otherwise your map will most likely just be a map of where your populace lives.