Spending Data Handbook
Cleaning data
Once you acquire some data, you will probably find that it's full of problems: program names are used inconsistently, financial amounts are stated in badly formatted numbers, and some data isn't usable at all due to file corruptions.
This is normal. Data always needs to be cleaned and processed before it can be used. In fact, processing and cleaning the data is very likely to be the most time- and labour-intensive aspect of your research project.
Normalizing data
Data that comes from the government is often generated by hand by multiple departments. This can result in inconsistencies in the data. Normalizing the data to make it consistent is therefore usually a necessary step.
Name normalization
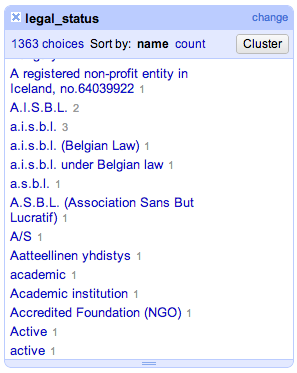
One common problem is the use of multiple data values to refer to the same entity. This can be a real-world entity, such as an individual or a company, in which case the multiple values are usually variations on the entity's name ("Acme Ltd.", "Acme Limited", "Acme", etc.), a combination of names and other identifiers, and so on. There can also be multiple values referring to the same number or truth value (e.g. "1,000,000" "1e6", "1 million").
For example, if you have a spreadsheet with contracting data, and one column is "Completed?", you would expect its distinct values to be "yes" or "no". But if your spreadsheet is an amalgam of spreadsheet data from multiple users and departments, the range of values might be much wider: "Y", "YES", "yes", 1, "True", "T", "t", "N", "NO", "no", 0, "False", "F", "f", and so on. Limiting all of these values to two clear options will make analyzing the data easier for you—and also easier for those who follow in your footsteps.
To detect this problem, have a look at all of the distinct values for each of the different columns in your dataset. You can do this by using the 'filter' command in a spreadsheet program, or you can use a database query language like SQL (in which case you would use the DISTINCT statement).
Numbers: format and scale
Numbers can be formatted many different ways. It's important to make sure that your dataset's format is consistent and is easily read by a computer program. For example, are your negative values represented with a "-" or placed inside "( )"? Are they perhaps even highlighted in red? Not all of these values will be easily read by a computer program (especially the highlighting), so you'll want to pick something clear and consistent to convert all your negative values to—in this case, probably the negative sign.
Besides the format of numbers, it's important to check their scale. Is all your numerical data measured out in ones, or is it an abbreviation for thousands? Especially with budget data, order of magnitude errors are not uncommon when one department thinks they're reporting in thousands or millions by default but others expand their data all the way to the ones. To check for problems with the scale of numbers, try creating a bar graph of each column. See where there are clusters of values, and make sure that each cluster makes sense.
Data quality
Data cleaning and data quality go hand in hand. Before doing analysis with data, you should assess the data's quality. If your data doesn't pass your tests, you might not want to perform analysis on it after all.
Criteria of quality
Completeness
Is all your data there? If your data is a time series, do you have approximately the same number of rows for each year, or are there major outliers? An extremely high or low number of rows that looks out of place may indicate duplicate or lost rows, or it could indicate a change in how data was reported at that time. Are there values for each column where values are required (according to the documentation)?
Accuracy
Does your dataset match up with other available data out there? This can be difficult to confirm, but it is often useful to employ a sampling methodology. Select a significant sample of your records (3-5%) and decide which values you can check for accuracy. If your data is transactional contract data, you could request the full contracts for your sample records and compare the structured data you have with the prose of the contract to confirm that it is correct. You can sometimes check contract and grant amounts from journalistic outlets or company websites.
Timeliness
Sometimes governments can lag behind in their reporting. Even if a dataset says it's for a specific time period, do you notice a long tail of records closer to the end of the time frame? If so, you may want to restrict your analysis to the subset of data where you have a healthy sampling.
Checking data quality: case studies
Some projects have gone beyond simple assessments of data quality to ensure confidence in the result of a project and become projects completely about data quality itself. These projects provide clear examples of what it means to check the quality of data.
The Open Knowledge Foundation has recently created a data quality monitor for UK transactional expenditure data, which has been developed in cooperation with the data.gov.uk team. Each imported file is documented, highlighting any mistakes in the data structure or formal representation of the data.
The Sunlight Foundation has run an annual report called Clearspending for the past three years that assesses the quality of the data reported in the US federal spending dashboard, USASpending.gov. The results haven't been very good, but they have highlighted the need for data standardization and oversight of the data release process.
Documenting data provenance
Your goal in doing data-driven research should always be to have your work hold up in court. To ensure this, it is necessary to keep good documentation on data provenance, the origin and history of your dataset.
Data provenance documentation can be compared to the chain of custody which is maintained for criminal investigations. Each previous owner of a dataset must be identified, and they are held accountable for the processing and cleaning operations they have performed on the data.
Tools for documenting data provenance
Documenting the transformations you perform on your data can be as simple as writing a detailed prose explanation and keeping a series of copies of your dataset that represent key intermediate steps in your processing.
When working with Excel spreadsheets, documenting data provenance would include writing down each of the steps taken in transforming the data. Advanced data cleaning tools like OpenRefine provide methods of exporting the history of data processing operations along with datasets. If you write a program to process data, the program should be made available when users access the resulting data and shared as open-source code on a public code-sharing site such as GitHub.
Using version control for your data work is an advanced method of tracking its history. Version control systems like Git and Mercurial can track every change made to the data and allow you to easily roll back edits if you make a mistake. Software Carpentry offer a good introduction to version control.
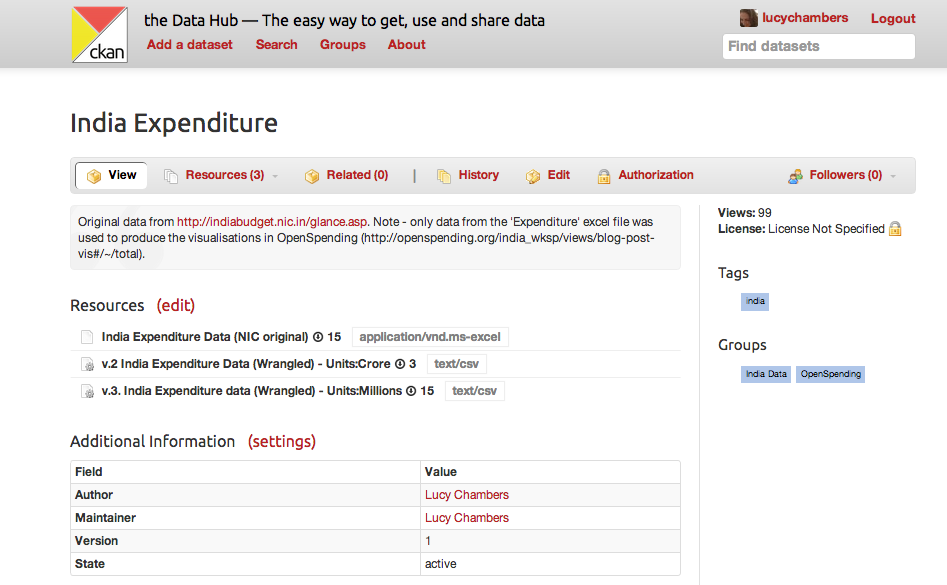
There are also products that are specifically designed to help you document data provenance. Socrata is an open data platform that helps you perform transforms on spreadsheet-like data and share them with others easily. You can also use the Data Hub (pictured below), an open-source platform that allows for several versions of a spreadsheet to be collected together into one dataset.