Spending Data Handbook
Case study: BudgIT
What does it look like when spending research is tailored directly to its audience? BudgIT, a Nigerian startup building public engagement with spending data, has done exactly that, making Nigerian spending more accessible by targeting social media. BudgIT is a valuable case study in data-driven online engagement.
Spending data and social media
Data is invaluable. To the uninformed person where an information asymmetry thrives, access to data illuminates the path to facts and provokes emotions that trigger results.
Poor handling of data, however, puts valuable facts in an opaque structure that communicates nothing. Data lost in a maze of thick documentation riddled with complex terms or iterations of figures doesn’t connect the user. Without being able to promote discussion or provide contextual understanding, data is worthless.
Nigeria returned to democracy in 1999 after long years of military rule. Data under the barrel of the gun was an exclusive preserve of rulers, as probing the facts behind data was taken as an affront to authority and an attempt to question the stained reputation of the junta. Civil servants were bound by the Official Secrets Act not to share government information, thereby putting the citizens in the dark.
Even after thirteen years of return to democracy, there is clearly a gap in accessing public data, with some government officials still stricken with a military-era hangover. Data on public expenditure in particular communicates little to the larger sections of public, who are not versed in financial accounting nor have the requisite understanding to evaluate the complex arithmetic.
BudgIT is a creative startup that sees a huge opportunity in using data visualization to stimulate interest in public expenditure. Understanding the ubiquity of the mobile device within the Nigerian locality and the increasing number of Nigerians online, BudgIT sees the opportunity to engage Nigerians and explain public expenditure in a simpler way. BudgIT's plan thrives on building engagement across all platforms, encouraging the community to action via NGOs, and reaching out to everyone to promote citizen participation. BudgIT's work is about making public data a social object and building an extensive network that demands change.
Building The Community
Across our interactions with users, we see a gulf in understanding what the budget is and what citizens usually expect. We have engaged over 10,000 Nigerians over the budget, and we have profiled them into three categories to ensure that optimum value is delivered. The categories are briefly explained below:
- Singular Users. These are users who want information in a simple and quick format. They are interested in data but not interested in analyzing the content or probing further. A series of simple tweets or an interactive application that gives them a snapshot of the data is enough for them to understand and retell the data's stories.
- Closed Loop Users. A set of users who stimulate discussion, engage the data channel effectively to increase their knowledge of subject matter, and challenge the assumptions of data. These users are adherents of the platform via social media. Hence they invest in building the platform through feedback systems and referral to their social connections.
- Data Hogs. This set of users wants raw datasets to rework visualizations and do analysis for personal or enterprise purposes. We simply give them the data for their own purposes.
Engaging the Citizen
Across every society lies a literacy span, and engaging every component is critical to societal growth and stability. Every life has a storyboard that volumes of data can be matched with. People always want to be more informed, especially concerning issues that they find difficult to understand.
Engaging citizens is means making a critical analysis of the target users at a specific point in time and optimizing for their possible profiles. A look at user profile demands a thorough analysis of their empathy and attention for and insight into the data available to them. What does the Nigerian citizen care about? Where is the information gap? How quickly can we reach out to them and place data in the storyboard of their lives? A critical understanding of the user’s psychology and the perceived response to the data is the first needed level of analysis.
BudgIT’s immediate reach is to the average literate Nigerian connected to online forums and social media. Most online users—amidst their array of interests in gaming, reading, and sharing social connections, which leaves a limited timeframe—will definitely need data in a brief and concise form. After presenting a snapshot of the data, either as a tweet or an infographic, there's an opportunity to build linked data on other platforms where the big picture can be set and interaction can be enhanced.
An important aspect of visualization, for us, is understanding the data appreciation level of the users. Complex diagrams, superb infographics, and aesthetic interactive applications might not convey the right meaning to the user, depending on his or her approach to data. Data vizualization needs to take into consideration how easily users can grasp the vizualized data and subject it to personal interpretation. A good visualization transfers knowledge and, most importantly, brings forth a story the user can easily connect with.
For us in BudgIT, our engagement model is anchored on the following:
- Stimulating discussion around trends. In engaging with users on public data, BudgIT keeps track of online and offline discussions and seeks to provide data to enliven interactions. A striking example was the fuel strikes in January 2012, where there was constant agitation among protesters on the need to reduce the size of government. BudgIT, tracking the discussion via social media in 36 active hours, quickly built an app allowing citizens to cut the Nigerian budget. The huge response, with over 3,000 users who interacted with the budget using the app, refined our engagement model. We keep looking for trends in the polity and matching them with relevant data quickly rendered into tweets or infographic displays, extending our influence.
- Constructive feedback mechanism and balanced outlook. Data speaks volumes, and individuals subject it to personal interpretations. In engagement with users, feedback is enabled through discussion boards and retweets. Most users throw up discussions that tend to ask about stories behind the data and to seek opinions about BudgIT. It's of utmost priority to ensure that opinions only explain the facts behind the data and do not conform to individual dispositions on the subject matter. It’s most necessary to build up feedback channels and engage the users creatively to ensure the community built around the data is sustained.
- Localized outlook of data. For a dataset targeted at a particular group, BudgIT builds competency to localise its content and promote a channel of discussion that connects to the users. This involves taking a cultural outlook at the icons, symbols, objects, and language to ensure that engagement with the budget flows seamlessly. This phase of engagement takes place with the grassroots, who mostly don’t have access to the Internet but only possess SMS-based mobile phones.
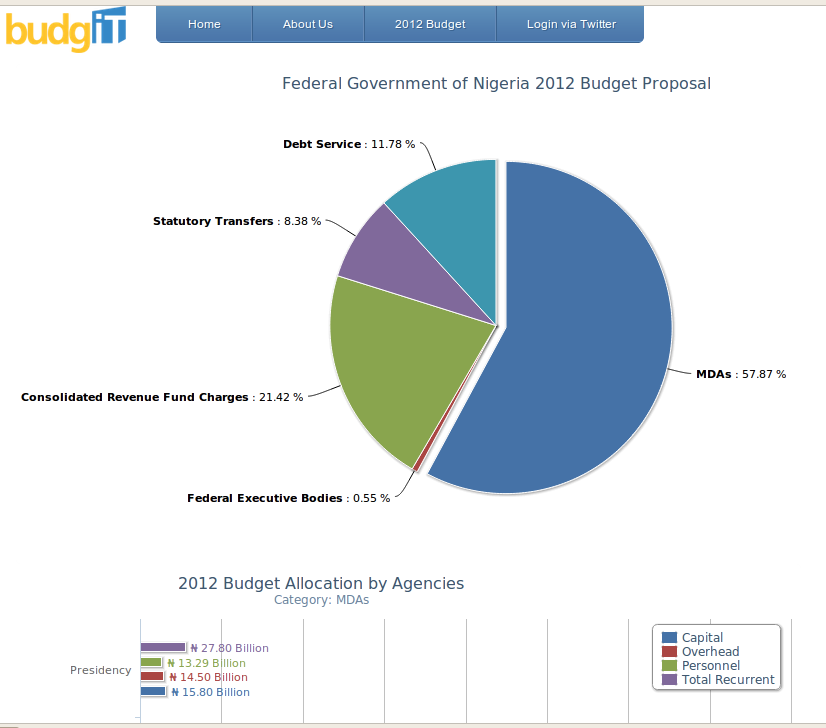
After making public expenditure data available in an easy-to-read format, as shown on our portal, we have reached out to citizens through civil society organizations to ensure that they can monitor capital projects in the budget.
We also plan to develop a participatory framework where citizens and government institutions can meet in town halls to determine key items in the budget that need to be prioritized. Once we get citizens to be aware of capital projects in the budget and connect them with civil societies where BudgIT is not located, citizens can track report projects and report status. Ensuring that citizens of any literacy are armed with data and possess a clear path to demand action, BudgIT is crossing the rubicon from open data to open action.